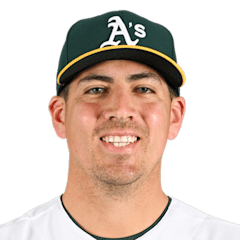
Dylan Cease RHP

2026 season (MLB rank among qualified starters)
ERA
2.25
7th
WHIP
1.04
33rd
K/9
12.72
2nd
BB/9
3.74
191st
P-Score80i
FIP
–
HR/9
0.58
13th
OPS/R
–
IP
156.1
Last 5 starts
ERA
2.10
Final score, pitching lines and standings context.
The Athletics did just enough early, then had the last answer late Monday night at Sutter Health Park, beating the Blue Jays 6-5 on a game-winning run in the bottom of the ninth.
Toronto erased most of a four-run deficit with a three-run seventh, then pulled even with a run in the ninth. But the Athletics immediately responded against Louis Varland, who allowed two hits, two walks and the deciding run while taking the loss.
The Athletics scored in four different innings and made the most of limited traffic, finishing with six hits but capitalizing on three Toronto errors. Henry Bolte set the tone with a 1-for-2 night that included a homer, three runs scored and three walks. Zack Gelof added two runs and two RBI, while Carlos Cortes went 2-for-2 with an RBI and Jeff McNeil drove in one.
Toronto’s offense was powered by three home runs. Andrés Giménez went 2-for-4 with a homer and two RBI, Alejandro Kirk finished 2-for-4 with a solo shot, and Kazuma Okamoto homered and walked twice.
Jacob Lopez worked 6.0 innings for Oakland, and despite Hogan Harris being charged with a blown save, the Athletics still came away with the final swing.
| Pitcher | Team | Role | IP | H | ER | BB | K | P |
|---|---|---|---|---|---|---|---|---|
| Dylan Cease | TOR | Starter | 5.0 | 4 | 4 | 2 | 6 | 94 |
| Louis Varland | TOR | ReliefLoss | 0.2 | 2 | 1 | 2 | 0 | 24 |
| Jacob Lopez | ATH | Starter | 6.0 | 7 | 4 | 1 | 1 | 93 |
| Hogan Harris | ATH | ReliefWin | 1.1 | 1 | 1 | 1 | 1 | 25 |
| 1 | 2 | 3 | 4 | 5 | 6 | 7 | 8 | 9 | R | H | E | |
|---|---|---|---|---|---|---|---|---|---|---|---|---|
| Toronto Blue Jays | 0 | 1 | 0 | 0 | 0 | 0 | 3 | 0 | 1 | 5 | 9 | 3 |
 Athletics | 2 | 0 | 2 | 0 | 1 | 0 | 0 | 0 | 1 | 6 | 6 | 0 |
At first glance, this matchup pulls in two different directions.
Toronto arrives with the better overall record at 72-71 and the hotter recent run, going 8-2 over its last 10 games while averaging 5.50 runs. The Athletics, though, have actually been the more productive offensive team over the full season. They hold the edge in runs per game (4.37 to 4.02), on-base percentage (.321 to .309), slugging (.406 to .382) and OPS (.727 to .691), and they have scored 5.30 runs per game over their last 10.
That makes the probable pitching matchup the clearest separator on the board.
Toronto is lined up to start Dylan Cease, whose season profile has been outstanding across the key categories: a 2.25 ERA, 2.40 FIP, 1.04 WHIP and 12.7 strikeouts per nine innings through 26 starts. He has also limited damage better than Jacob Lopez, allowing 0.58 homers per nine compared with Lopez's 1.46, and his quality-start rate sits at 58 percent.
Lopez has had a tougher season for the Athletics. In 20 starts, the left-hander owns a 4.71 ERA, 4.84 FIP and 1.46 WHIP, with a 20 percent quality-start rate. He can miss some bats at 8.8 strikeouts per nine, but the overall run-prevention gap between the two starters is substantial. By every supplied comparison — ERA, FIP, WHIP, strikeout rate, walk rate, home-run rate and quality-start percentage — Toronto has the edge on the mound.
That edge matters even more because Toronto also brings the stronger bullpen numbers. The Blue Jays' relief group has a 4.45 ERA and 1.36 WHIP, both better than the Athletics' 5.59 ERA and 1.51 WHIP. If this game becomes a battle of run prevention after the starters exit, the numbers still lean Toronto's way.
So the central question is whether the Athletics' better season-long offense can pressure Cease enough to change the shape of the game. Their lineup has been more effective than Toronto's over six months, and it has been scoring well lately. But this is also a matchup where the Blue Jays can reasonably expect their biggest advantage to come from the mound first, then the bullpen behind it.
For the Athletics, the path is narrower: keep Cease from controlling the game early and make Toronto's lighter season offense do more against Lopez than it has on average this year.
Pitch data coverage: partial. Usage and velocity only.
TOR·ATHTOR·ATHTOR·ATHTOR·ATH