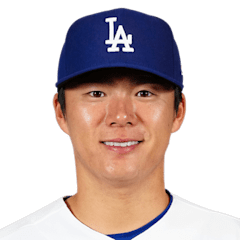
Robbie Ray LHP

2026 season (MLB rank among qualified starters)
ERA
3.60
58th
WHIP
1.33
130th
K/9
7.65
137th
BB/9
4.60
203rd
P-Score49i
FIP
–
HR/9
1.22
109th
OPS/R
–
IP
162.1
Last 5 starts
ERA
3.81
Final score, pitching lines and standings context.
| Pitcher | Team | Role | IP | H | ER | BB | K | P |
|---|---|---|---|---|---|---|---|---|
| Robbie Ray | SD | Starter | 3.1 | 7 | 1 | 1 | 2 | 84 |
| Bradgley Rodriguez | SD | ReliefWin | 2.0 | 1 | 0 | 1 | 3 | 37 |
| Yoshinobu Yamamoto | LAD | StarterLoss | 6.0 | 5 | 2 | 1 | 4 | 88 |
| 1 | 2 | 3 | 4 | 5 | 6 | 7 | 8 | 9 | R | H | E | |
|---|---|---|---|---|---|---|---|---|---|---|---|---|
| San Diego Padres | 0 | 0 | 0 | 2 | 2 | 0 | 0 | 0 | 1 | 5 | 8 | 0 |
 Los Angeles Dodgers | 0 | 0 | 0 | 1 | 0 | 0 | 0 | 0 | 0 | 1 | 10 | 1 |
The Dodgers opened this series with a 7-0 win, but the final score masks just how well San Diego had been playing before arriving in Los Angeles. Both clubs are 15-5 over their last 20 games, with the Dodgers riding a five-game winning streak and the Padres sitting at 8-2 over their last 10.
Los Angeles owns the broader edge in the NL West, leading San Diego by 10 games, and Yoshinobu Yamamoto gives the Dodgers another significant advantage on the mound. Through 179 innings, Yamamoto has a 2.51 ERA, 3.28 FIP and 0.87 WHIP. He has delivered a quality start in 78 percent of his outings. Robbie Ray has produced a respectable 3.60 ERA for San Diego, but his 4.73 FIP and 4.6 walks per nine make the comparison less favorable.
The Padres’ best statistical response may come after Ray leaves the game. Their bullpen owns a 3.49 ERA, fifth in MLB, compared with 3.82 for Los Angeles.
Getting there with the game intact is the challenge. The Dodgers average 5.01 runs per game and rank second in both slugging percentage and OPS. They are also 51-28 at home and have won eight of 11 meetings with San Diego this season. After being shut out in the opener, the Padres now have to solve Yamamoto to prevent Los Angeles from taking the series before the finale.
Pitch data coverage: partial. Usage and velocity only.
Weighted by batting-order spot. Season rates are regressed toward league average before they enter the model.
SDSlight edge: LAD
SD·LADSD·LADSD·LADSD·LAD