FinalFinal lineupsAL Central / NL West

Minnesota Twins 4, San Francisco Giants 2

Final Score and Game Recap

Final score, pitching lines and standings context.

3:45 PM ET · Oracle ParkGame-day snapshot Sep 25, 2:01 AM ETFinal lineups lockedCurrent 2026 season stats — updated Oct 29, 5:00 AM ET
T-Score40
77–85 · 3rd AL Central · T-Score 40
4
4–2
FINAL · 9 innings
65–97 · 4th NL West · T-Score 31
2
T-Score31
FINAL · 9 innings
Pitching recap
PitcherTeamRoleIPHERBBKP
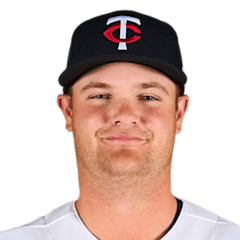
Connor PrielippMIN
Starter
5.1422377
Yoendrys GómezMIN
ReliefWin
1.2000224
Andrew MorrisMIN
ReliefSave
1.0101223
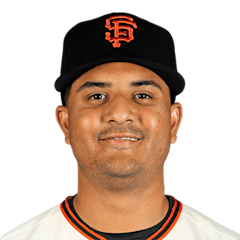
Cesar PerdomoSF
Starter
5.1520277
Dylan SmithSF
ReliefLoss
0.2121117
Scoring by inning
123456789RHE
MINMinnesota Twins001010200490
SFSan Francisco Giants000200000251
Top hitters
Luke Keaschall1-for-3 · 1 HR · 2 RBI
Shay Whitcomb2-for-4 · 2 RBI
Walker Jenkins1-for-2 · 1 RBI · 1 R
Josh Bell1-for-5 · 1 RBI
Bo Davidson1-for-3 · 1 R

Matchup at a glance

PitcherStat calculation
CategoryComparisonWhy
Starting pitcherTwinsThe starters are close overall, but Prielipp owns the better strikeout and control profile.
Offense vs handEvenThe handedness splits are nearly even, with less than a .020 difference in OPS.
LineupEvenBoth confirmed lineups are close to their normal everyday configuration.
WeatherModerate impactA 14 mph wind could modestly increase carry on fly balls.

Pregame contextStarting pitchers

2026 season (MLB rank among qualified starters)
ERA
4.94
156th
WHIP
1.30
106th
K/9
9.35
59th
BB/9
3.14
113th
P-Score52i
FIP
–
HR/9
1.05
76th
OPS/R
–
IP
120.1
Last 5 starts
ERA
2.70
QUALITY
START %
20%
(1 of 5)
DAYS
REST
5
2026 season (MLB rank among qualified starters)
ERA
3.72
WHIP
1.50
K/9
5.59
BB/9
3.26
FIP
–
HR/9
1.40
OPS/R
–
IP
19.1
Last 5 starts
ERA
3.72
QUALITY
START %
25%
(1 of 4)
DAYS
REST
5
How the starters differ
·Prielipp strikes out 3.8 more batters per nine innings.
·Prielipp allows fewer baserunners, with a 1.30 WHIP compared with 1.50.
·Perdomo enters with a 3.72 ERA compared with Prielipp's 4.94.
·Prielipp allows the lower home-run rate: 1.05 vs 1.40 per nine.

How the lineups match the starters' pitch mix

Pitch data coverage: partial. Usage and velocity only.

Prielipp arsenal
PitchUsageVelo
Slider30%87.9
Four-seam27%95.6
Curveball18%83.1
Sinker15%95.0
Changeup10%86.7
Perdomo arsenal
PitchUsageVelo
Four-seam46%93.0
Changeup30%86.8
Slider23%85.6
Sinker1%92.7

Team OPS vs opposing starter's hand

26th
in MLB
0.678OPS
.600.700.800.9001.000
29th
in MLB
0.658OPS
.600.700.800.9001.000

Lineup strength vs today's starter

Weighted by batting-order spot. Season rates are regressed toward league average before they enter the model.

Updated Sep 23, 12:45 PM ET
MINMIN
.718
+36 ptsOPS edge
SFSF
.682

Even matchuplimited data

Lineups

Final lineupsOrder from the stored snapshot; treat as unofficial until the card is filed.Full lineup page
Minnesota TwinsOfficial lineupvs LHP Cesar Perdomo

Team comparison

ResultsMINMIN·SFSF
+38413th
Run differential
+29426th
77–85 Record65–97
Last 10 games
Minnesota Twins Recent form unavailable
San Francisco Giants Recent form unavailable
2026 head-to-head
Season Series
0—0
0 Games Played

Frequently asked

Who is starting for the Twins?+
Connor Prielipp (4.94 ERA, 6–7) is listed as the starter.
Who is starting for the Giants?+
Cesar Perdomo (3.72 ERA, 0–1) is listed as the starter.
What time does the game start?+
3:45 PM ET at Oracle Park.
Where is the game being played?+
Oracle Park, home of the San Francisco Giants.
Are the lineups confirmed?+
Not as official league cards. The orders shown are the current projected or last-posted lineups.
How do the starters compare on P-Score?+
P-Score is available for one starter only.