

Freddy Peralta RHP
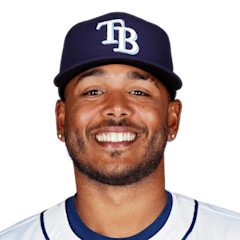
2026 season (MLB rank among qualified starters)
ERA
4.56
133rd
WHIP
1.33
127th
K/9
8.36
103rd
BB/9
3.30
132nd
P-Score54i
FIP
–
HR/9
1.26
120th
OPS/R
–
IP
163.2
Last 5 starts
ERA
0.94
Final score, pitching lines and standings context.
| Pitcher | Team | Role | IP | H | ER | BB | K | P |
|---|---|---|---|---|---|---|---|---|
| Freddy Peralta | TB | StarterWin | 5.1 | 4 | 0 | 3 | 4 | 93 |
| Bryan Baker | TB | ReliefSave | 1.0 | 0 | 0 | 0 | 0 | 11 |
| Cristopher Sánchez | PHI | StarterLoss | 7.0 | 5 | 2 | 1 | 10 | 100 |
| 1 | 2 | 3 | 4 | 5 | 6 | 7 | 8 | 9 | R | H | E | |
|---|---|---|---|---|---|---|---|---|---|---|---|---|
| Tampa Bay Rays | 1 | 1 | 0 | 0 | 0 | 0 | 0 | 0 | 0 | 2 | 6 | 0 |
 Philadelphia Phillies | 0 | 0 | 0 | 0 | 0 | 0 | 0 | 0 | 0 | 0 | 4 | 1 |
Tampa Bay still owns first place in the AL East, but the Rays arrive in Philadelphia looking for a reset.
They have lost two straight. So have the Phillies.
The difference in the opener is the man Philadelphia sends to the mound.
Cristopher Sánchez has reached 200 innings with a 2.93 ERA and 2.81 FIP. He has struck out 9.9 batters per nine while walking only 2.0, and 66 percent of his starts have ended as quality starts. It has been a long season of sustained work rather than a small hot stretch.
Freddy Peralta’s year has been more uneven. Tampa Bay’s probable starter owns a 4.56 ERA and 4.31 FIP over 163.2 innings, with a 1.33 WHIP. The supplied comparison favors Sánchez in ERA, FIP, WHIP, strikeout rate, walk rate and home-run rate.
That does not leave Philadelphia with every edge.
Tampa Bay’s bullpen has allowed fewer baserunners, carrying a 1.20 WHIP compared with Philadelphia’s 1.35. The Rays also have the slightly better scoring offense, 4.52 runs per game to 4.43.
Neither club comes in rolling. Tampa Bay is 6-4 over its last 10 but has dropped two in a row; Philadelphia is 5-5 and also enters on a two-game slide.
This is the first meeting between the teams this season. For the Phillies, the cleanest path into the series is obvious: give the ball to Sánchez and make Tampa Bay beat one of their most reliable starters.
Pitch data coverage: partial. Usage and velocity only.
Weighted by batting-order spot. Season rates are regressed toward league average before they enter the model.
TBEven matchup
TB·PHITB·PHITB·PHITB·PHI