Andrew Abbott LHP
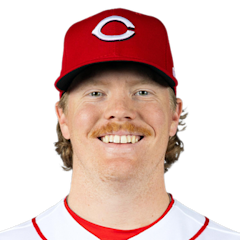
2026 season (MLB rank among qualified starters)
ERA
4.43
145th
WHIP
1.42
174th
K/9
7.09
162nd
BB/9
4.14
189th
P-Score45i
FIP
–
HR/9
1.30
151st
OPS/R
–
IP
152.1
Last 5 starts
ERA
4.94
Final score, pitching lines and standings context.
| Pitcher | Team | Role | IP | H | ER | BB | K | P |
|---|---|---|---|---|---|---|---|---|
| Andrew Abbott | CIN | StarterLoss | 2.0 | 9 | 8 | 0 | 0 | 43 |
| Dustin May | MIL | StarterWin | 6.0 | 2 | 0 | 1 | 6 | 84 |
| Garrett Stallings | MIL | ReliefSave | 3.0 | 0 | 0 | 1 | 2 | 30 |
| 1 | 2 | 3 | 4 | 5 | 6 | 7 | 8 | 9 | R | H | E | |
|---|---|---|---|---|---|---|---|---|---|---|---|---|
| Cincinnati Reds | 0 | 0 | 0 | 0 | 0 | 0 | 0 | 0 | 0 | 0 | 2 | 1 |
 Milwaukee Brewers | 2 | 6 | 0 | 1 | 8 | 0 | 0 | 3 | 0 | 20 | 23 | 1 |
The biggest gap in Friday’s matchup at American Family Field is not hard to find: Milwaukee has separated itself from Cincinnati over the course of the season in almost every team-level category that matters.
The Brewers enter at 91-56, good for first place in the NL Central, while the Reds are 69-77 and sit fifth, 21.5 games back. That difference shows up on both sides of the ball. Milwaukee has been the more productive offense, averaging 5.05 runs per game to Cincinnati’s 4.18 while posting better marks in average (.257 to .230), on-base percentage (.339 to .308) and OPS (.739 to .706). Slugging is nearly even, with Milwaukee only narrowly ahead (.400 to .398), but the Brewers have still turned their overall offensive profile into a substantial scoring advantage.
There is also a recent-scoring bump for Milwaukee. Over the last 10 games, the Brewers have gone 6-4 and averaged 5.90 runs per game, compared with 5-5 and 4.80 runs per game for the Reds. That is a small sample, but it fits the larger season picture rather than contradicting it.
The most interesting wrinkle comes on the mound, where the probable starters present a more mixed first look. Cincinnati’s Andrew Abbott has the slightly lower ERA at 4.43, compared with 4.69 for Milwaukee’s Dustin May. But much of the rest of the comparison leans toward May. His FIP is 3.50 to Abbott’s 4.77, his WHIP is lower (1.32 to 1.42), and he has the better strikeout, walk and home-run rates. May is also at 44 percent in quality starts, compared with 38 percent for Abbott.
That combination suggests Milwaukee’s starter has the stronger underlying profile, even if the ERAs are close enough to keep the pitching matchup from being one-sided on the surface.
If the game gets past the starters early, Milwaukee’s bullpen numbers only reinforce the broader edge. The Brewers carry a 3.52 bullpen ERA, a 1.17 WHIP and 9.7 strikeouts per nine innings, all comfortably better than Cincinnati’s 4.70 ERA, 1.41 WHIP and 8.4 K/9.
With lineups still unconfirmed, the cleanest way to frame this one is simple: the Reds’ clearest statistical opening is Abbott’s modest ERA edge, but Milwaukee brings the stronger overall case through its offense, bullpen and the deeper set of numbers behind May’s probable start.
Pitch data coverage: partial. Usage and velocity only.
CIN·MILCIN·MILCIN·MILCIN·MIL