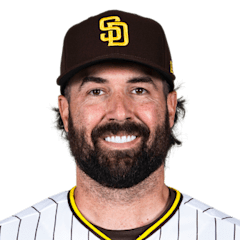
Robbie Ray LHP
2026 season (MLB rank among qualified starters)
ERA
3.39
58th
WHIP
1.34
130th
K/9
7.55
137th
BB/9
4.58
203rd
P-Score49i
FIP
–
HR/9
1.19
109th
OPS/R
–
IP
151.1
Last 5 starts
ERA
3.42
Final score, pitching lines and standings context.
San Diego did enough early to survive San Francisco’s push, beating the Giants 7-5 on Friday at Oracle Park. The matchup followed the pregame script when the Padres’ overall edge held up even after the Giants finally broke through offensively.
The game turned on the first three innings against Anthony Molina, who opened for San Francisco and was charged with all 7 runs on 9 hits in 3.0 innings. The Padres fell behind 1-0 in the first, then answered with 2 runs in the second and 5 more in the third. Jackson Merrill set the tone at the top of the order, going 3-for-5 with 2 runs, while Dustin Harris had 2 hits, 2 runs and 2 RBI. Freddy Fermin added 2 RBI, and Xander Bogaerts drove in 2.
Robbie Ray got the win despite allowing all 5 Giants runs in 5.0 innings. San Francisco’s big answer came with 4 runs in the fifth, and Rafael Devers finished with 4 RBI and a home run. But that was the end of the scoring. Yuki Matsui, Adrian Morejon, Bradgley Rodriguez and Mason Miller combined for 4 scoreless innings, with Miller recording his 35th save. Yunior Marte followed Molina with 5.0 scoreless innings for the Giants.
| Pitcher | Team | Role | IP | H | ER | BB | K | P |
|---|---|---|---|---|---|---|---|---|
| Robbie Ray | SD | StarterWin | 5.0 | 4 | 5 | 4 | 5 | 94 |
| Mason Miller | SD | ReliefSave | 1.0 | 1 | 0 | 2 | 2 | 27 |
| Anthony Molina | SF | StarterLoss | 3.0 | 9 | 7 | 2 | 4 | 72 |
| 1 | 2 | 3 | 4 | 5 | 6 | 7 | 8 | 9 | R | H | E | |
|---|---|---|---|---|---|---|---|---|---|---|---|---|
| San Diego Padres | 0 | 2 | 5 | 0 | 0 | 0 | 0 | 0 | 0 | 7 | 12 | 0 |
 San Francisco Giants | 1 | 0 | 0 | 0 | 4 | 0 | 0 | 0 | 0 | 5 | 6 | 1 |
The broad shape of this matchup favors San Diego. The Padres bring the better record at 78-68, sit second in the NL West, and have been the more effective club over the full season than a San Francisco team that is 62-85 and fourth in the division.
But this game gets more interesting once the focus narrows.
Season-long, the two offenses have been much closer than the records suggest. San Diego owns only a 4.24-to-4.20 edge in runs per game. The Giants actually hold slight advantages in batting average (.248 to .238), slugging (.407 to .388) and OPS (.716 to .703), while the Padres have been a little better at getting on base (.315 to .309). There is no overwhelming lineup gap here.
And over the last 10 games, San Francisco has been the more productive scoring club by a wide margin. Both teams are 6-4 in that stretch, but the Giants have scored 5.70 runs per game compared with 4.00 for the Padres. That recent split is one reason this does not look like a simple record-versus-record matchup.
The probable starting pitchers add another layer. San Francisco’s Anthony Molina has made only two starts, so the sample is limited, but the early numbers are hard to miss: a 2.79 ERA, 0.88 WHIP and just 1.4 walks per nine innings in 19.1 innings. Molina also owns the better ERA, FIP and WHIP in this matchup, along with a much lower walk rate than San Diego’s Robbie Ray.
Ray’s profile is more uneven statistically, but it comes with far more volume. Across 27 starts and 151.1 innings, the left-hander has a 3.39 ERA and has produced a quality start in 41 percent of his outings. He has also been slightly better than Molina at limiting home runs and owns the higher strikeout rate. If this game turns on which starter can work deeper, Ray’s track record gives San Diego a clearer case there than San Francisco has with Molina, whose quality-start percentage is still at zero through two starts.
The Padres also carry the more convincing bullpen numbers, with a 3.63 relief ERA, 1.24 WHIP and 8.4 strikeouts per nine, all better than the Giants’ marks of 4.45, 1.35 and 7.2.
That leaves a fairly clear tension in this game: San Diego has the stronger season résumé and the better relief unit, while San Francisco comes in with the hotter recent attack and a probable starter whose first two turns have been sharp.
Pitch data coverage: partial. Usage and velocity only.
SD·SFSD·SFSD·SFSD·SF