FinalFinal lineupsAL East

Baltimore Orioles 1, Toronto Blue Jays 8

Final Score and Game Recap

Final score, pitching lines and standings context.

1:37 PM ET · Rogers CentreGame-day snapshot Sep 13, 4:40 PM ETFinal lineups lockedCurrent 2026 season stats — updated Oct 8, 5:01 AM ET
T-Score51
79–82 · 4th AL East · T-Score 51
1
1–8
FINAL · 9 innings
79–83 · 5th AL East · T-Score 44
8
T-Score44
FINAL · 9 innings

Springer drives in 4 as Blue Jays beat Orioles 8-1

The matchup followed the pregame script when Dylan Cease piled up 9 strikeouts and Toronto turned its chances against Trevor Rogers into an 8-1 win over Baltimore at Rogers Centre.

The Blue Jays scored first in the 2nd, added 3 more in the 5th and then broke the game open with 4 in the 8th. George Springer led the offense with a home run and 4 RBIs, Vladimir Guerrero Jr. went 4-for-5 with a homer and an RBI, and Kazuma Okamoto also homered.

Trevor Rogers kept Baltimore in it for a while, but Toronto still got to him for 4 runs on 7 hits over 6 innings. The decisive separation came after he left. Yaramil Hiraldo was charged with 4 runs in 1.2 innings, with 4 walks helping fuel the 8th-inning surge.

Baltimore’s only run came in the 5th, when Pete Alonso drove in Dylan Beavers. Cease allowed that lone run over 5 innings, working around 5 walks while limiting the damage. From there, Ricky Tiedemann, Braydon Fisher, Mason Fluharty, Tyler Rogers and Michael Lorenzen combined for 4 scoreless innings to seal it.

Pitching recap
PitcherTeamRoleIPHERBBKP
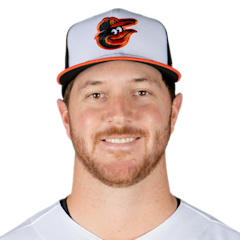
Trevor RogersBAL
StarterLoss
6.0741595
Dylan CeaseTOR
StarterWin
5.0415994
Scoring by inning
123456789RHE
BALBaltimore Orioles000010000190
TORToronto Blue Jays0100300408100
Top hitters
George Springer2-for-5 · 1 HR · 4 RBI
Vladimir Guerrero Jr.4-for-5 · 1 HR · 1 RBI
Kazuma Okamoto1-for-3 · 1 HR · 1 RBI · 1 BB
Pete Alonso3-for-5 · 1 RBI
Andrés Giménez1-for-4 · 1 RBI

Matchup at a glance

PitcherStat calculation
CategoryComparisonWhy
Starting pitcherJaysToronto has the stronger starting-pitcher profile: Cease leads in P-Score, WHIP and K/9.
Offense vs handOriolesBaltimore owns a .715 OPS vs RHP, 18th in MLB; Toronto ranks 28th vs LHP.
BullpenJaysToronto owns a 3.30 bullpen ERA this season, compared with Baltimore's 4.06.
Recent formJaysToronto has been the better recent team, at 6–4 over the last 10.
WeatherModerate impactA 14 mph wind could modestly increase carry on fly balls.

Pregame contextStarting pitchers

2026 season (MLB rank among qualified starters)
ERA
4.15
105th
WHIP
1.21
65th
K/9
8.19
101st
BB/9
2.20
24th
P-Score61i
FIP
–
HR/9
0.95
79th
OPS/R
–
IP
151.2
Last 5 starts
ERA
3.94
QUALITY
START %
80%
(4 of 5)
DAYS
REST
6
2026 season (MLB rank among qualified starters)
ERA
2.40
7th
WHIP
1.04
33rd
K/9
12.66
2nd
BB/9
3.74
191st
P-Score80i
FIP
–
HR/9
0.61
13th
OPS/R
–
IP
161.1
Last 5 starts
ERA
2.40
QUALITY
START %
80%
(4 of 5)
DAYS
REST
6
How the starters differ
·Cease strikes out 4.5 more batters per nine innings.
·Cease enters with a 2.40 ERA compared with Rogers's 4.15.
·Cease allows fewer baserunners, with a 1.04 WHIP compared with 1.21.
·Rogers has been more vulnerable to home runs, allowing 0.34 more per nine innings.

Orioles at Blue Jays — Cease's Strikeouts Against Rogers' Command

Dylan Cease leads the day at 12.7 strikeouts per nine, with a 2.40 ERA his 2.47 FIP fully supports and a 0.6 home run rate. Trevor Rogers takes the opposite route: 2.2 walks per nine on the season, and just 0.8 over his last five starts, with a 3.44 FIP that undercuts his 4.15 ERA. Toronto scores less than any other team in MLB at 4.03 per game, but has managed 5.10 over its last 10 while winning six. Baltimore, the better season offense at 4.50, has scored 4.10 during a 3-7 stretch. Two games separate them in the AL East. Both bullpens have been heavily worked, nine arms each over the last three days.

How the lineups match the starters' pitch mix

Pitch data coverage: partial. Usage and velocity only.

Rogers arsenal
PitchUsageVelo
Four-seam47%93.8
Changeup21%87.0
Sweeper14%78.1
Sinker10%93.4
Cutter8%83.1
Cease arsenal
PitchUsageVelo
Four-seam37%96.8
Slider30%88.7
Changeup11%81.4
Knuckle Curve10%81.7
Sinker8%95.8
Sweeper3%83.4

Team OPS vs opposing starter's hand

18th
in MLB
0.715OPS
.600.700.800.9001.000
28th
in MLB
0.660OPS
.600.700.800.9001.000

Lineup strength vs today's starter

Weighted by batting-order spot. Season rates are regressed toward league average before they enter the model.

Updated Sep 13, 11:57 AM ET
BALBAL
.722
+14 ptsOPS edge
TORTOR
.708

Even matchup

Lineups

Final lineupsOrder from the stored snapshot; treat as unofficial until the card is filed.Full lineup page
Baltimore OriolesOfficial lineupvs RHP Dylan Cease
Toronto Blue JaysOfficial lineupvs LHP Trevor Rogers

Team comparison

OffenseBALBAL·TORTOR
AVG.234 27th.247 9th
OPS.710 21st.691 28th
Home runs199 10th152 30th
Runs718 17th648 30th
OBP.314 21st.310 25th
SLG.396 22nd.381 26th
PitchingBALBAL·TORTOR
1stMLB rank30th
ERA4.07vs3.90
BALTOR
WHIP1.34vs1.29
BALTOR
K/98.2vs8.8
BALTOR
HR Allowed169vs167
BALTOR
BullpenBALBAL·TORTOR
1stMLB rank30th
Bullpen ERA4.06vs3.30
no league rank
Bullpen WHIP1.28vs1.22
no league rank
Saves46vs52
BALTOR
ResultsBALBAL·TORTOR
+33110th
Run differential
+24622nd
79–82 Record79–83
3–7 Last 106–4
Last 10 games
L
W
W
L
W
L
L
L
L
L
W
L
L
W
L
L
W
W
W
W
2026 head-to-head
Season Series
6—7
13 Games Played

Frequently asked

Who is starting for the Orioles?+
Trevor Rogers (4.15 ERA, 10–9) is listed as the starter.
Who is starting for the Jays?+
Dylan Cease (2.40 ERA, 10–5) is listed as the starter.
What time does the game start?+
1:37 PM ET at Rogers Centre.
Where is the game being played?+
Rogers Centre, home of the Toronto Blue Jays.
Are the lineups confirmed?+
Not as official league cards. The orders shown are the current projected or last-posted lineups.
How have the Orioles and Jays performed head-to-head?+
Season series: Jays 7–6 this season.
How do the starters compare on P-Score?+
Trevor Rogers is at 61; Dylan Cease is at 80. P-Score is PitcherStat's 0–100 season index for qualified starters.