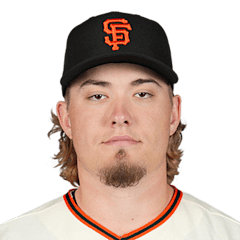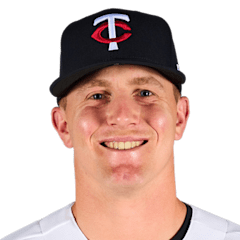
FinalFinal lineupsAL Central / NL West

Minnesota Twins 2, San Francisco Giants 5

Final Score and Game Recap

Final score, pitching lines and standings context.

9:45 PM ET · Oracle ParkGame-day snapshot Sep 23, 2:01 AM ETFinal lineups lockedCurrent 2026 season stats — updated Oct 9, 5:00 AM ET
T-Score49
77–85 · 3rd AL Central · T-Score 49
2
2–5
FINAL · 9 innings
65–97 · 4th NL West · T-Score 40
5
T-Score40
FINAL · 9 innings
Pitching recap
PitcherTeamRoleIPHERBBKP
Zebby MatthewsMIN
StarterLoss
5.08509100
Blade TidwellSF
Starter
3.1310457
Tristan BeckSF
ReliefWin
2.2000132
Trent HarrisSF
ReliefSave
1.0000116
Scoring by inning
123456789RHE
MINMinnesota Twins000100010240
SFSan Francisco Giants2200100005100
Top hitters
Drew Gilbert3-for-4 · 1 HR · 3 RBI
Brooks Lee1-for-4 · 1 HR · 1 RBI
Emmanuel Rodriguez1-for-3 · 1 HR · 1 RBI
Brett Harris2-for-4 · 2 RBI
Bo Davidson1-for-4 · 1 R

Matchup at a glance

PitcherStat calculation
CategoryComparisonWhy
Starting pitcherTwinsMatthews holds a modest edge in P-Score and last-5 ERA, while the ERA gap is small.
Offense vs handEvenBoth offenses perform near the same level against the opposing starter's handedness.
LineupTwinsMinnesota's official lineup includes 3 left-handed bats against the opposing starter.
BullpenEvenThe two bullpens have produced similar season ERA and WHIP.
Recent formTwinsMinnesota has been the better recent team, at 4–6 over the last 10.

Pregame contextStarting pitchers

2026 season (MLB rank among qualified starters)
ERA
4.74
157th
WHIP
1.24
95th
K/9
7.68
119th
BB/9
2.80
68th
P-Score49i
FIP
–
HR/9
1.65
192nd
OPS/R
–
IP
125.1
Last 5 starts
ERA
1.97
QUALITY
START %
60%
(3 of 5)
DAYS
REST
5
2026 season (MLB rank among qualified starters)
ERA
4.56
135th
WHIP
1.20
62nd
K/9
7.09
150th
BB/9
3.54
127th
P-Score39i
FIP
–
HR/9
1.18
128th
OPS/R
–
IP
53.1
Last 5 starts
ERA
4.78
QUALITY
START %
20%
(1 of 5)
DAYS
REST
6
How the starters differ
·Tidwell allows the lower home-run rate: 1.18 vs 1.65 per nine.
·Matthews has produced a quality start in 75% of outings versus 20%.
·Matthews has the stronger command profile, with a 2.8 BB/9 versus 3.5.
·Matthews owns a 1.97 ERA over his last five starts, compared with 4.78 for Tidwell.

Matthews and Tidwell Bring Similar Numbers, Different Profiles

Minnesota and San Francisco open their first series of the season with two starters whose headline numbers look remarkably close. Zebby Matthews carries a 4.74 ERA and 4.81 FIP through 22 starts, while Blade Tidwell sits at 4.56 and 4.75 across a much smaller eight-start sample.

Matthews has been the cleaner strike-thrower, walking 2.8 per nine while also producing the better strikeout rate at 7.7 K/9. Tidwell’s edge has come elsewhere: he has kept the ball in the park more effectively, allowing 1.20 home runs per nine compared with Matthews’ 1.70.

Minnesota has scored more consistently this season at 4.56 runs per game, but its bullpen has been a persistent weak spot statistically, carrying a 4.83 ERA and 1.50 WHIP. San Francisco’s relief numbers are better, though hardly dominant. Neither team arrives with much momentum, either: the Twins are 4–6 over their last 10, while the Giants are 3–7 and have lost three straight. That makes the opener less about one clear edge and more about which side can avoid exposing its weaker innings.

How the lineups match the starters' pitch mix

Pitch data coverage: partial. Usage and velocity only.

Matthews arsenal
PitchUsageVelo
Four-seam36%95.2
Slider23%87.3
Changeup13%86.8
Cutter12%90.9
Curveball11%79.9
Sinker5%95.2
Tidwell arsenal
PitchUsageVelo
Four-seam33%95.1
Sweeper32%82.5
Sinker17%93.1
Slider9%88.0
Changeup4%83.4
Curveball4%83.4

Team OPS vs opposing starter's hand

8th
in MLB
0.739OPS
.600.700.800.9001.000
12th
in MLB
0.728OPS
.600.700.800.9001.000

Lineup strength vs today's starter

Weighted by batting-order spot. Season rates are regressed toward league average before they enter the model.

Updated Sep 21, 7:45 PM ET
MINMIN
.731
+58 ptsOPS edge
SFSF
.673

Slight edge: MINlimited data

Lineups

Final lineupsOrder from the stored snapshot; treat as unofficial until the card is filed.Full lineup page
Minnesota TwinsOfficial lineupvs RHP Blade Tidwell

Team comparison

OffenseMINMIN·SFSF
AVG.245 14th.245 13th
OPS.720 11th.706 23rd
Home runs187 12th178 20th
Runs739 9th669 26th
OBP.317 14th.306 29th
SLG.403 10th.400 17th
PitchingMINMIN·SFSF
1stMLB rank30th
ERA4.56vs4.33
MINSF
WHIP1.36vs1.36
MINSF
K/98.7vs7.6
MINSF
HR Allowed186vs160
MINSF
BullpenMINMIN·SFSF
1stMLB rank30th
Bullpen ERA4.34vs4.45
no league rank
Bullpen WHIP1.43vs1.46
no league rank
Saves45vs30
MINSF
ResultsMINMIN·SFSF
+29018th
Run differential
+24724th
77–85 Record65–97
4–6 Last 103–7
Last 10 games
W
L
W
L
W
L
L
L
W
L
L
L
L
W
W
L
L
L
L
W
2026 head-to-head
Season Series
3—0
3 Games Played

Frequently asked

Who is starting for the Twins?+
Zebby Matthews (4.74 ERA, 9–10) is listed as the starter.
Who is starting for the Giants?+
Blade Tidwell (4.56 ERA, 1–2) is listed as the starter.
What time does the game start?+
9:45 PM ET at Oracle Park.
Where is the game being played?+
Oracle Park, home of the San Francisco Giants.
Are the lineups confirmed?+
Not as official league cards. The orders shown are the current projected or last-posted lineups.
How have the Twins and Giants performed head-to-head?+
Season series: Giants 0–3 this season.
How do the starters compare on P-Score?+
Zebby Matthews is at 49; Blade Tidwell is at 39. P-Score is PitcherStat's 0–100 season index for qualified starters.