FinalFinal lineupsNL Central

Chicago Cubs 9, Cincinnati Reds 1

Final Score and Game Recap

Final score, pitching lines and standings context.

1:40 PM ET · Great American Ball ParkGame-day snapshot Sep 22, 2:01 AM ETFinal lineups lockedCurrent 2026 season stats — updated Oct 29, 5:00 AM ET
T-Score51
89–73 · 2nd NL Central · T-Score 51
9
9–1
FINAL · 9 innings
75–87 · 5th NL Central · T-Score 19
1
T-Score19
FINAL · 9 innings
Pitching recap
PitcherTeamRoleIPHERBBKP
David PetersonCHC
StarterWin
6.0311783
Rhett LowderCIN
StarterLoss
3.0653360
Scoring by inning
123456789RHE
CHCChicago Cubs1040300109131
CINCincinnati Reds000100000140
Top hitters
Pete Crow-Armstrong3-for-5 · 1 HR · 2 RBI
Seiya Suzuki1-for-5 · 1 HR · 1 RBI
Michael Conforto1-for-5 · 1 HR · 1 RBI
JJ Bleday1-for-3 · 1 HR · 1 RBI · 1 BB
Pedro Ramírez3-for-5 · 2 RBI · 1 R

Matchup at a glance

PitcherStat calculation
CategoryComparisonWhy
Starting pitcherCubsChicago has the stronger starting-pitcher profile: Peterson leads in P-Score, K/9 and last-5 ERA.
Offense vs handCubsChicago has produced the stronger offense against right-handed pitching.
LineupCubsChicago's official lineup includes 3 left-handed bats against the opposing starter.
Team strengthCubsChicago leads 51–19 in T-Score, driven by stronger offense.
WeatherLow impact87°F, wind 7 mph, no precipitation expected at first pitch.

Pregame contextStarting pitchers

2026 season (MLB rank among qualified starters)
ERA
5.11
155th
WHIP
1.55
194th
K/9
8.13
104th
BB/9
4.06
175th
P-Score49i
FIP
–
HR/9
0.92
53rd
OPS/R
–
IP
137.1
Last 5 starts
ERA
3.08
QUALITY
START %
40%
(2 of 5)
DAYS
REST
6
2026 season (MLB rank among qualified starters)
ERA
5.79
199th
WHIP
1.52
200th
K/9
7.09
171st
BB/9
3.69
160th
P-Score36i
FIP
–
HR/9
1.30
115th
OPS/R
–
IP
124.1
Last 5 starts
ERA
6.41
QUALITY
START %
20%
(1 of 5)
DAYS
REST
5
How the starters differ
·Peterson owns a 8.1 K/9 compared with Lowder's 7.1.
·Peterson allows the lower home-run rate: 0.92 vs 1.30 per nine.
·Peterson enters with a 5.11 ERA compared with Lowder's 5.79.
·Peterson has produced a quality start in 50% of outings versus 25%.

How the lineups match the starters' pitch mix

Pitch data coverage: partial. Usage and velocity only.

Peterson arsenal
PitchUsageVelo
Sinker30%92.2
Four-seam25%92.5
Slider22%86.4
Changeup13%85.7
Curveball11%80.5

Team OPS vs opposing starter's hand

3rd
in MLB
0.757OPS
.600.700.800.9001.000
10th
in MLB
0.717OPS
.600.700.800.9001.000

Lineup strength vs today's starter

Weighted by batting-order spot. Season rates are regressed toward league average before they enter the model.

Updated Sep 20, 11:41 AM ET
CHCCHC
.774
+64 ptsOPS edge
CINCIN
.710

Clear edge: CHC

Lineups

Final lineupsOrder from the stored snapshot; treat as unofficial until the card is filed.Full lineup page
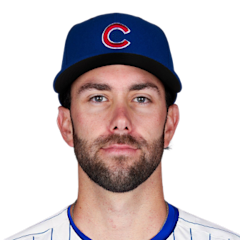
Chicago CubsOfficial lineupvs RHP Rhett Lowder
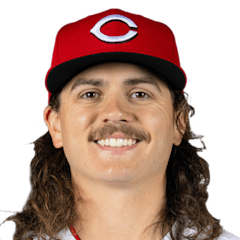
Cincinnati RedsOfficial lineupvs LHP David Peterson

Team comparison

ResultsCHCCHC·CINCIN
+5081st
Run differential
+23229th
89–73 Record75–87
Last 10 games
Chicago Cubs Recent form unavailable
Cincinnati Reds Recent form unavailable
2026 head-to-head
Season Series
0—0
0 Games Played

Frequently asked

Who is starting for the Cubs?+
David Peterson (5.11 ERA, 8–8) is listed as the starter.
Who is starting for the Reds?+
Rhett Lowder (5.79 ERA, 6–11) is listed as the starter.
What time does the game start?+
1:40 PM ET at Great American Ball Park.
Where is the game being played?+
Great American Ball Park, home of the Cincinnati Reds.
Are the lineups confirmed?+
Not as official league cards. The orders shown are the current projected or last-posted lineups.
How do the starters compare on P-Score?+
David Peterson is at 49; Rhett Lowder is at 36. P-Score is PitcherStat's 0–100 season index for qualified starters.