FinalFinal lineupsAL East / NL East

Boston Red Sox 7, Miami Marlins 3

Final Score and Game Recap

Final score, pitching lines and standings context.

6:40 PM ET · loanDepot parkGame-day snapshot Aug 25, 10:15 PM ETFinal lineups lockedCurrent 2026 season stats — updated Oct 29, 5:00 AM ET
T-Score45
87–75 · 3rd AL East · T-Score 45
7
7–3
FINAL
80–82 · 3rd NL East · T-Score 42
3
T-Score42
FINAL

Matchup at a glance

PitcherStat calculation
CategoryComparisonWhy
Starting pitcherSoxBoston has the stronger starting-pitcher profile: Tolle leads in P-Score, WHIP and K/9.
Offense vs handEvenBoth offenses perform near the same level against the opposing starter's handedness.
LineupMarlinsMiami's official lineup includes 7 right-handed bats against the opposing starter.
BullpenEvenThe two bullpens have produced similar season ERA and WHIP.
Recent formSoxBoston has been the better recent team, at 7–3 over the last 10.

Starting pitchers

2026 season (MLB rank among qualified starters)
ERA
3.08
30th
WHIP
1.08
28th
K/9
10.05
27th
BB/9
2.48
47th
P-Score72i
FIP
–
HR/9
0.98
50th
OPS/R
–
IP
120.0
Last 5 starts
ERA
2.37
QUALITY
START %
60%
(3 of 5)
DAYS
REST
6
2026 season (MLB rank among qualified starters)
ERA
3.67
41st
WHIP
1.37
125th
K/9
7.06
156th
BB/9
3.75
176th
P-Score46i
FIP
–
HR/9
1.16
115th
OPS/R
–
IP
100.2
Last 5 starts
ERA
4.18
QUALITY
START %
0%
(0 of 5)
DAYS
REST
7
How the starters differ
·Tolle strikes out 3.0 more batters per nine innings.
·Tolle allows fewer baserunners, with a 1.08 WHIP compared with 1.37.
·Tolle has produced a quality start in 60% of outings versus 0%.
·Tolle enters with a 3.08 ERA compared with Phillips's 3.67.
Advanced starter metricsERA−, FIP, WAR, career vs opponent
MetricTollePhillipsNote
Career vs opponent–– ERA, 1 GSCareer history against this opponent.

How the lineups match the starters' pitch mix

Pitch data coverage: partial. Usage and velocity only.

Tolle arsenal
PitchUsageVelo
Four-seam45%96.1
Sinker24%94.8
Cutter19%88.6
Curveball9%82.9
Changeup3%88.6
Phillips arsenal
PitchUsageVelo
Sinker26%95.5
Sweeper24%84.2
Splitter23%87.0
Curveball17%83.5
Four-seam8%96.1
Slider1%87.1

Team OPS vs opposing starter's hand

22nd
in MLB
0.711OPS
.600.700.800.9001.000
24th
in MLB
0.684OPS
.600.700.800.9001.000

Lineups

Final lineupsOrder from the stored snapshot; treat as unofficial until the card is filed.Full lineup page
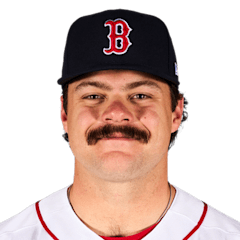
Boston Red SoxOfficial lineupvs RHP Tyler Phillips
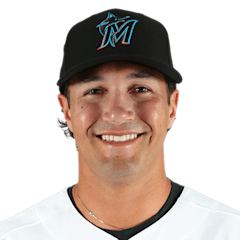
Miami MarlinsOfficial lineupvs LHP Payton Tolle

Team comparison

OffenseBOSBOS·MIAMIA
AVG.245 14th.249 7th
OPS.717 19th.726 10th
Home runs163 26th168 23rd
Runs689 23rd715 18th
OBP.319 12th.326 6th
SLG.398 20th.400 18th
PitchingBOSBOS·MIAMIA
1stMLB rank30th
ERA3.54vs4.09
BOSMIA
WHIP1.23vs1.28
BOSMIA
K/98.7vs8.3
BOSMIA
HR Allowed153vs171
BOSMIA
BullpenBOSBOS·MIAMIA
1stMLB rank30th
Bullpen ERA3.37vs3.71
no league rank
Bullpen WHIP1.22vs1.22
no league rank
Saves46vs35
BOSMIA
ResultsBOSBOS·MIAMIA
+37915th
Run differential
+36217th
87–75 Record80–82
7–3 Last 105–5
Last 10 games
W
W
W
W
L
W
W
L
W
L
L
W
W
W
L
L
L
W
W
L
2026 head-to-head
Season Series
2—1
3 Games Played

Frequently asked

Who is starting for the Sox?+
Payton Tolle (3.08 ERA, 8–6) is listed as the starter.
Who is starting for the Marlins?+
Tyler Phillips (3.67 ERA, 3–6) is listed as the starter.
What time does the game start?+
6:40 PM ET at loanDepot park.
Where is the game being played?+
loanDepot park, home of the Miami Marlins.
Are the lineups confirmed?+
Not as official league cards. The orders shown are the current projected or last-posted lineups.
How have the Sox and Marlins performed head-to-head?+
Season series: Marlins 1–2 this season.
How do the starters compare on P-Score?+
Payton Tolle is at 72; Tyler Phillips is at 46. P-Score is PitcherStat's 0–100 season index for qualified starters.