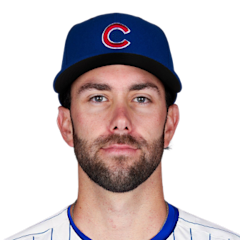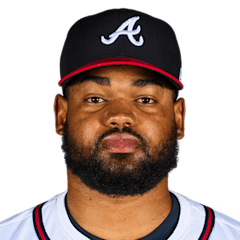
FinalFinal lineupsNL East / NL Central

Atlanta Braves 3, Chicago Cubs 7

Final Score and Game Recap

Final score, pitching lines and standings context.

7:40 PM ET · Wrigley FieldGame-day snapshot Sep 16, 2:01 AM ETFinal lineups lockedCurrent 2026 season stats — updated Oct 8, 5:01 AM ET
T-Score55
94–68 · 1st NL East · T-Score 55
3
3–7
FINAL · 9 innings
89–73 · 2nd NL Central · T-Score 64
7
T-Score64
FINAL · 9 innings
Pitching recap
PitcherTeamRoleIPHERBBKP
Reynaldo LópezATL
StarterLoss
3.0652262
David PetersonCHC
StarterWin
6.0313785
Scoring by inning
123456789RHE
ATLAtlanta Braves000000300380
CHCChicago Cubs0320020007101
Top hitters
Pete Crow-Armstrong4-for-5 · 1 HR · 4 RBI
Mike Yastrzemski1-for-1 · 1 HR · 2 RBI · 1 BB
Nico Hoerner2-for-4 · 1 RBI · 2 R
Carson Kelly1-for-3 · 1 RBI · 2 R · 1 BB
Michael Conforto1-for-4 · 1 RBI

Matchup at a glance

PitcherStat calculation
CategoryComparisonWhy
Starting pitcherEvenThe starters grade similarly overall, with no clear advantage across P-Score, ERA and WHIP.
Offense vs handCubsChicago owns a .757 OPS vs RHP, 3th in MLB; Atlanta ranks 21th vs LHP.
LineupBravesAtlanta's official lineup includes 5 right-handed bats against the opposing starter.
Starter formCubsPeterson has a 3.20 ERA over his last five starts, while López is at 5.84.
WeatherModerate impactA 11 mph wind could modestly increase carry on fly balls.

Pregame contextStarting pitchers

2026 season (MLB rank among qualified starters)
ERA
4.13
142nd
WHIP
1.39
170th
K/9
8.37
106th
BB/9
3.77
167th
P-Score43i
FIP
–
HR/9
1.30
126th
OPS/R
–
IP
76.1
Last 5 starts
ERA
5.84
QUALITY
START %
0%
(0 of 5)
DAYS
REST
5
2026 season (MLB rank among qualified starters)
ERA
5.28
155th
WHIP
1.58
194th
K/9
8.02
104th
BB/9
4.04
175th
P-Score50i
FIP
–
HR/9
0.96
53rd
OPS/R
–
IP
131.1
Last 5 starts
ERA
3.20
QUALITY
START %
20%
(1 of 5)
DAYS
REST
6
How the starters differ
·López allows fewer baserunners, with a 1.39 WHIP compared with 1.58.
·López enters with a 4.13 ERA compared with Peterson's 5.28.
·Peterson has produced a quality start in 33% of outings versus 0%.
·López has been more vulnerable to home runs, allowing 0.34 more per nine innings.

Two Struggling Starters and a Cubs Lineup That Punishes Lefties

Atlanta is 88-61 and leads the NL East; Chicago is 83-66 and second in the Central. Both are 5-5 in their last ten, so the separation has to come from elsewhere — and it comes from the bats. The Cubs score 5.36 runs per game to Atlanta's 4.65, with a 48-point OPS edge built on a .339 on-base percentage against .311.

Neither starter inspires confidence. David Peterson has a 5.28 ERA and a 1.58 WHIP, the worst WHIP among today's starters, with 4.0 walks per nine and quality starts in only 15% of his outings; his 4.14 FIP does suggest some bad luck, and his recent strikeout rate of 10.5 per nine is genuinely good, but 5.6 walks per nine over those same five starts is not. Reynaldo López carries a lower 4.13 ERA on a thin 76.1-inning sample, with an 8% quality-start rate and a 5.84 ERA over his last five. Both have been averaging around five innings or fewer.

The handedness note cuts in Atlanta's favor here: Chicago posts an .807 OPS against left-handed pitching, but it is Chicago's own Peterson who throws left-handed, and Atlanta's split against lefties is a mild .698. Atlanta also holds the bullpen edge at 3.41 against 3.89, with better strikeout and WHIP numbers. Wrigley is the one venue where conditions matter today: a 14 mph wind, 65°F and a 0.98 park factor.

How the lineups match the starters' pitch mix

Pitch data coverage: partial. Usage and velocity only.

López arsenal
PitchUsageVelo
Four-seam54%94.1
Slider31%84.2
Curveball11%74.6
Changeup4%84.3
Peterson arsenal
PitchUsageVelo
Sinker30%92.2
Four-seam25%92.5
Slider22%86.4
Changeup13%85.7
Curveball11%80.5

Team OPS vs opposing starter's hand

21st
in MLB
0.696OPS
.600.700.800.9001.000
3rd
in MLB
0.757OPS
.600.700.800.9001.000

Lineup strength vs today's starter

Weighted by batting-order spot. Season rates are regressed toward league average before they enter the model.

Updated Sep 14, 4:41 PM ET
ATLATL
.724
−50 ptsOPS edge
CHCCHC
.774

Clear edge: CHC

Lineups

Final lineupsOrder from the stored snapshot; treat as unofficial until the card is filed.Full lineup page
Atlanta BravesOfficial lineupvs LHP David Peterson
Chicago CubsOfficial lineupvs RHP Reynaldo López

Team comparison

OffenseATLATL·CHCCHC
AVG.246 10th.251 6th
OPS.718 17th.767 1st
Home runs204 8th220 3rd
Runs742 8th850 1st
OBP.309 28th.339 2nd
SLG.409 7th.428 1st
PitchingATLATL·CHCCHC
1stMLB rank30th
ERA3.63vs4.12
ATLCHC
WHIP1.24vs1.26
ATLCHC
K/98.4vs7.8
ATLCHC
HR Allowed185vs231
ATLCHC
BullpenATLATL·CHCCHC
1stMLB rank30th
Bullpen ERA3.89vs3.90
no league rank
Bullpen WHIP1.25vs1.27
no league rank
Saves49vs36
ATLCHC
ResultsATLATL·CHCCHC
+32012th
Run differential
+4422nd
94–68 Record89–73
5–5 Last 105–5
Last 10 games
L
W
W
W
L
L
L
W
L
W
Chicago Cubs (5–5)
L
W
W
L
L
L
L
W
W
W
2026 head-to-head
Season Series
2—4
6 Games Played

Frequently asked

Who is starting for the Braves?+
Reynaldo López (4.13 ERA, 4–4) is listed as the starter.
Who is starting for the Cubs?+
David Peterson (5.28 ERA, 7–8) is listed as the starter.
What time does the game start?+
7:40 PM ET at Wrigley Field.
Where is the game being played?+
Wrigley Field, home of the Chicago Cubs.
Are the lineups confirmed?+
Not as official league cards. The orders shown are the current projected or last-posted lineups.
How have the Braves and Cubs performed head-to-head?+
Season series: Cubs 4–2 this season.
How do the starters compare on P-Score?+
Reynaldo López is at 43; David Peterson is at 50. P-Score is PitcherStat's 0–100 season index for qualified starters.