George Kirby RHP

2026 season (MLB rank among qualified starters)
ERA
4.25
125th
WHIP
1.36
155th
K/9
7.51
136th
BB/9
2.12
45th
P-Score54i
FIP
–
HR/9
1.14
98th
OPS/R
–
IP
165.1
Last 5 starts
ERA
5.40
Final score, pitching lines and standings context.
| Pitcher | Team | Role | IP | H | ER | BB | K | P |
|---|---|---|---|---|---|---|---|---|
| George Kirby | SEA | Starter | 4.1 | 5 | 2 | 5 | 5 | 93 |
| Carlos Vargas | SEA | ReliefWin | 1.1 | 1 | 0 | 0 | 3 | 18 |
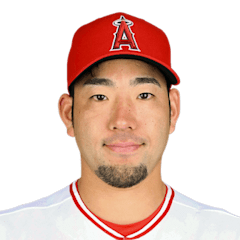
| Yusei Kikuchi | LAA | StarterLoss | 4.1 | 5 | 4 | 5 | 4 | 99 |
| 1 | 2 | 3 | 4 | 5 | 6 | 7 | 8 | 9 | R | H | E | |
|---|---|---|---|---|---|---|---|---|---|---|---|---|
| Seattle Mariners | 2 | 0 | 0 | 0 | 3 | 2 | 0 | 0 | 0 | 7 | 9 | 1 |
 Los Angeles Angels | 1 | 1 | 0 | 0 | 0 | 0 | 0 | 0 | 0 | 2 | 10 | 2 |
There is almost nothing between Seattle and Los Angeles offensively, and not in a flattering way. The Mariners average 4.06 runs per game, the Angels 4.05; their OPS marks rank 28th and 30th in MLB. That puts extra weight on every free pass and every mistake from the starters. George Kirby has issued only 2.1 walks per nine and owns the cleaner overall line, while Yusei Kikuchi brings more strikeouts but also a 1.49 WHIP and 3.9 walks per nine. The teams have split eight games this season. Seattle has lost three straight, Los Angeles has won two, and a matchup between two quiet offenses may not need many runs to turn.
Pitch data coverage: partial. Usage and velocity only.
Weighted by batting-order spot. Season rates are regressed toward league average before they enter the model.
SEASlight edge: SEA
SEA·LAASEA·LAASEA·LAASEA·LAA