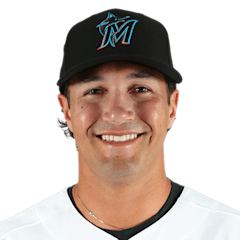
Tyler Glasnow RHP

2026 season (MLB rank among qualified starters)
ERA
3.12
54th
WHIP
0.88
9th
K/9
10.92
4th
BB/9
2.65
107th
P-Score69i
FIP
–
HR/9
0.78
37th
OPS/R
–
IP
57.2
Last 5 starts
ERA
2.84
Final score, pitching lines and standings context.
| Pitcher | Team | Role | IP | H | ER | BB | K | P |
|---|---|---|---|---|---|---|---|---|
| Tyler Glasnow | LAD | StarterLoss | 4.0 | 5 | 4 | 4 | 7 | 91 |
| Tyler Phillips | MIA | Starter | 3.2 | 2 | 2 | 3 | 3 | 68 |
| Cade Gibson | MIA | ReliefWin | 1.1 | 0 | 0 | 0 | 0 | 15 |
| Pete Fairbanks | MIA | ReliefSave | 1.0 | 1 | 1 | 1 | 0 | 22 |
| 1 | 2 | 3 | 4 | 5 | 6 | 7 | 8 | 9 | R | H | E | |
|---|---|---|---|---|---|---|---|---|---|---|---|---|
| Los Angeles Dodgers | 2 | 0 | 0 | 0 | 0 | 0 | 0 | 0 | 1 | 3 | 4 | 1 |
 Miami Marlins | 0 | 3 | 0 | 0 | 1 | 0 | 0 | 0 | 0 | 4 | 7 | 0 |
The broad shape of Saturday’s matchup at loanDepot park is easy to spot: the Dodgers arrive with the better record, the stronger season-long offense, the sharper bullpen numbers and the more imposing probable starter on paper.
Los Angeles enters at 90-57 and sits first in the NL West, while Miami is 72-76 and third in the NL East. That gap shows up across the offensive profile as well. The Dodgers have been the more productive lineup over the full season, averaging 4.99 runs per game to Miami’s 4.43 while also holding edges in average (.257 to .249), on-base percentage (.337 to .327), slugging (.422 to .401) and OPS (.759 to .728).
That season-long advantage has been reinforced lately. The Dodgers are 8-2 over their last 10 games and have scored 6.40 runs per game in that span. Miami has scored well recently too — 5.90 runs per game over its last 10 — but that has come alongside a 3-7 record, a contrast that makes this game more interesting than the overall records alone might suggest.
The clearest individual matchup edge belongs to Los Angeles if the probable starters hold. Tyler Glasnow has the stronger statistical line in nearly every category against Tyler Phillips. Glasnow carries a 3.12 ERA, 2.68 FIP and 0.88 WHIP through 10 starts, along with 10.9 strikeouts per nine innings. Phillips has been solid enough to give Miami a chance with a 3.51 ERA in 17 starts, but the underlying comparison tilts heavily toward Glasnow: Phillips owns a 4.50 FIP, 1.33 WHIP and 7.3 strikeouts per nine. Glasnow also has better rates in walks, home runs allowed and quality starts percentage.
That doesn’t mean Phillips has been ineffective. A 3.51 ERA over 115.1 innings is meaningful work, and his larger workload has helped steady Miami’s rotation. But in a single-game preview, Glasnow’s combination of run prevention, swing-and-miss ability and traffic control stands out.
If the game turns to the bullpens, the Dodgers again have the statistical edge. Their relievers have posted a 3.59 ERA, 1.17 WHIP and 9.6 K/9, compared with Miami’s 4.13 ERA, 1.29 WHIP and 8.4 K/9.
With lineups still unconfirmed, the central question remains straightforward: can Miami’s recently improved run scoring overcome Los Angeles’ stronger season-long profile and the more favorable pitching setup? The Dodgers have more paths on paper, and that is what defines this matchup.
Pitch data coverage: partial. Usage and velocity only.
LAD·MIALAD·MIALAD·MIALAD·MIA