
Nick Martinez RHP
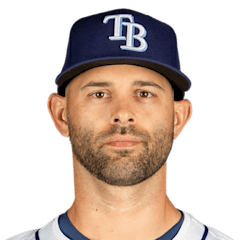
2026 season (MLB rank among qualified starters)
ERA
2.94
32nd
WHIP
1.07
26th
K/9
5.31
221st
BB/9
1.26
1st
P-Score59i
FIP
–
HR/9
1.10
92nd
OPS/R
–
IP
171.1
Last 5 starts
ERA
2.43
Final score, pitching lines and standings context.
| Pitcher | Team | Role | IP | H | ER | BB | K | P |
|---|---|---|---|---|---|---|---|---|
| Nick Martinez | TB | StarterLoss | 6.0 | 5 | 2 | 1 | 7 | 94 |
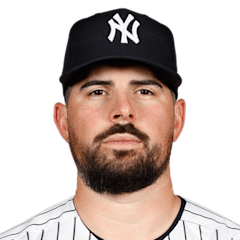
| Carlos Rodón | NYY | StarterWin | 8.0 | 3 | 0 | 0 | 8 | 96 |
| David Bednar | NYY | ReliefSave | 1.0 | 0 | 0 | 0 | 0 | 11 |
| 1 | 2 | 3 | 4 | 5 | 6 | 7 | 8 | 9 | R | H | E | |
|---|---|---|---|---|---|---|---|---|---|---|---|---|
| Tampa Bay Rays | 0 | 0 | 0 | 0 | 0 | 0 | 0 | 0 | 0 | 0 | 3 | 0 |
 New York Yankees | 0 | 0 | 0 | 2 | 0 | 0 | 0 | 0 | 0 | 2 | 5 | 0 |
The second Rays-Yankees game of the day pairs two starters whose season lines leave little room between them. Drew Rasmussen has worked 165.1 innings with a 2.72 ERA, 2.88 FIP and 0.93 WHIP. Max Fried counters with a 2.63 ERA, matching 2.63 FIP and a 0.98 WHIP.
The differences are in how they have reached those numbers. Rasmussen has walked only 1.6 hitters per nine and owns the better strikeout rate of the two. Fried has been exceptionally difficult to take deep, allowing just 0.30 home runs per nine. Rasmussen has also produced a quality start in 61 percent of his outings.
There is plenty beyond the mound. Tampa Bay holds a six-game AL East lead at 95-60 and has won eight of its last 10. New York owns the first AL Wild Card position and backs Fried with a bullpen ranked second in MLB with a 3.14 ERA. The Yankees have hit 216 home runs, second-most in baseball, while Tampa Bay has the stronger on-base percentage. The Rays have won six of the first nine meetings.
Pitch data coverage: partial. Usage and velocity only.
Weighted by batting-order spot. Season rates are regressed toward league average before they enter the model.
TBSlight edge: TB
TB·NYYTB·NYYTB·NYYTB·NYY