FinalFinal lineupsNL West

Los Angeles Dodgers 4, San Francisco Giants 3

Final Score and Game Recap

Final score, pitching lines and standings context.

4:05 PM ET · Oracle ParkGame-day snapshot Sep 28, 2:00 AM ETFinal lineups lockedCurrent 2026 season stats — updated Oct 29, 5:00 AM ET
T-Score56
100–62 · 1st NL West · T-Score 56
4
4–3
FINAL · 9 innings
65–97 · 4th NL West · T-Score 31
3
T-Score31
FINAL · 9 innings
Pitching recap
PitcherTeamRoleIPHERBBKP
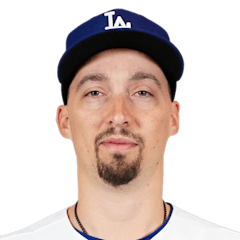
Blake SnellLAD
Starter
4.0510377
Evan PhillipsLAD
ReliefWin
1.0110115
Tanner ScottLAD
ReliefSave
1.0100214
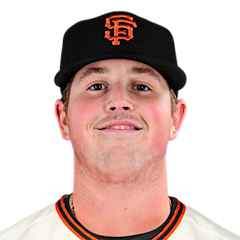
Matt WilkinsonSF
Starter
3.0111237
Trent HarrisSF
ReliefLoss
1.0210016
Scoring by inning
123456789RHE
LADLos Angeles Dodgers001200001490
SFSan Francisco Giants001000110390
Top hitters
Mookie Betts1-for-5 · 1 HR · 1 RBI
Enrique Hernández1-for-4 · 1 HR · 1 RBI
Tommy Edman2-for-4 · 1 RBI
Bo Davidson2-for-3 · 1 RBI
Drew Cavanaugh2-for-2 · 1 RBI

Matchup at a glance

PitcherStat calculation
CategoryComparisonWhy
Starting pitcherDodgersLos has the stronger starting-pitcher profile: Snell leads in P-Score, K/9 and ERA.
Offense vs handDodgersLos owns a .756 OPS vs LHP, 5th in MLB; San ranks 29th vs LHP.
LineupDodgersThe confirmed Los order includes 6 hitters with an OPS above .750 against left-handed pitching.
BullpenDodgersLos owns a 3.65 bullpen ERA this season, compared with San's 4.37.
Recent formDodgersLos has been the better recent team, at 7–3 over the last 10.

Pregame contextStarting pitchers

2026 season (MLB rank among qualified starters)
ERA
1.86
4th
WHIP
1.09
30th
K/9
12.10
5th
BB/9
3.72
133rd
P-Score78i
FIP
–
HR/9
0.00
1st
OPS/R
–
IP
38.2
Last 5 starts
ERA
0.94
QUALITY
START %
40%
(2 of 5)
DAYS
REST
10
2026 season (MLB rank among qualified starters)
ERA
3.65
57th
WHIP
1.01
11th
K/9
6.57
190th
BB/9
1.46
3rd
P-Score42i
FIP
–
HR/9
1.46
190th
OPS/R
–
IP
24.2
Last 5 starts
ERA
1.64
QUALITY
START %
20%
(1 of 5)
DAYS
REST
6
How the starters differ
·Snell strikes out 5.5 more batters per nine innings.
·Snell enters with a 1.86 ERA compared with Wilkinson's 3.65.
·Snell allows the lower home-run rate: 0.00 vs 1.46 per nine.
·Wilkinson walks 2.3 fewer batters per nine innings.

How the lineups match the starters' pitch mix

Pitch data coverage: partial. Usage and velocity only.

Snell arsenal
PitchUsageVelo
Four-seam50%96.0
Curveball22%79.9
Changeup18%84.8
Slider11%88.8
Wilkinson arsenal
PitchUsageVelo
Four-seam58%90.4
Changeup23%83.8
Slider14%79.2
Cutter5%83.6

Team OPS vs opposing starter's hand

5th
in MLB
0.756OPS
.600.700.800.9001.000
29th
in MLB
0.658OPS
.600.700.800.9001.000

Lineup strength vs today's starter

Weighted by batting-order spot. Season rates are regressed toward league average before they enter the model.

Updated Sep 26, 5:35 PM ET
LADLAD
.746
+73 ptsOPS edge
SFSF
.673

Slight edge: LADlimited data

Lineups

Final lineupsOrder from the stored snapshot; treat as unofficial until the card is filed.Full lineup page
Los Angeles DodgersOfficial lineupvs LHP Matt Wilkinson
San Francisco GiantsOfficial lineupvs LHP Blake Snell

Team comparison

OffenseLADLAD·SFSF
AVG.257 3rd.245 16th
OPS.762 2nd.706 24th
Home runs204 9th178 20th
Runs801 4th669 26th
OBP.338 3rd.306 29th
SLG.424 2nd.400 17th
PitchingLADLAD·SFSF
1stMLB rank30th
ERA3.55vs4.33
LADSF
WHIP1.14vs1.36
LADSF
K/99.5vs7.6
LADSF
HR Allowed172vs160
LADSF
BullpenLADLAD·SFSF
1stMLB rank30th
Bullpen ERA3.65vs4.37
no league rank
Bullpen WHIP1.24vs1.44
no league rank
Saves46vs30
LADSF
ResultsLADLAD·SFSF
+4703rd
Run differential
+29426th
100–62 Record65–97
7–3 Last 103–7
Last 10 games
W
L
L
W
W
W
W
W
L
W
L
L
L
W
L
L
L
W
W
L
2026 head-to-head
Season Series
9—4
13 Games Played

Frequently asked

Who is starting for the Dodgers?+
Blake Snell (1.86 ERA, 4–1) is listed as the starter.
Who is starting for the Giants?+
Matt Wilkinson (3.65 ERA, 1–3) is listed as the starter.
What time does the game start?+
4:05 PM ET at Oracle Park.
Where is the game being played?+
Oracle Park, home of the San Francisco Giants.
Are the lineups confirmed?+
Not as official league cards. The orders shown are the current projected or last-posted lineups.
How have the Dodgers and Giants performed head-to-head?+
Season series: Giants 4–9 this season.
How do the starters compare on P-Score?+
Blake Snell is at 78; Matt Wilkinson is at 42. P-Score is PitcherStat's 0–100 season index for qualified starters.