FinalFinal lineupsNL East / NL West

Atlanta Braves 3, Los Angeles Dodgers 2

Final Score and Game Recap

Final score, pitching lines and standings context.

8:00 PM ET · UNIQLO Field at Dodger StadiumGame-day snapshot Oct 6, 2:00 AM ETFinal lineups lockedCurrent 2026 season stats — updated Oct 12, 5:00 AM ET
T-Score55
94–68 · 1st NL East · T-Score 55
3
3–2
FINAL · 9 innings
100–62 · 1st NL West · T-Score 66
2
T-Score66
FINAL · 9 innings
Pitching recap
PitcherTeamRoleIPHERBBKP
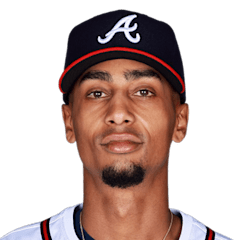
Ray KerrATL
Starter
2.2201442
Dylan LeeATL
ReliefWin
0.2101114
Raisel IglesiasATL
ReliefSave
0.100003
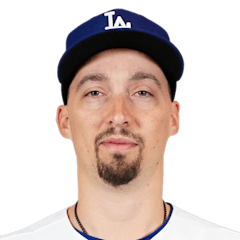
Blake SnellLAD
Starter
3.2315590
Kris BubicLAD
ReliefLoss
0.2111017
Scoring by inning
123456789RHE
ATLAtlanta Braves100010100360
LADLos Angeles Dodgers000100001260
Top hitters
Freddie Freeman2-for-4 · 1 HR · 1 RBI
Max Muncy1-for-3 · 1 HR · 1 RBI
Michael Harris II3-for-5 · 1 RBI · 1 R
Mauricio Dubón1-for-3 · 1 RBI · 1 BB
Ronald Acuña Jr.1-for-5 · 1 R

Matchup at a glance

PitcherStat calculation
CategoryComparisonWhy
Starting pitcherBravesThe starters are close overall, but Kerr owns the better strikeout and control profile.
Offense vs handDodgersLos has produced the stronger offense against left-handed pitching.
LineupDodgersThe confirmed Los order includes 6 hitters with an OPS above .750 against left-handed pitching.
Recent formDodgersLos has won 8 of its last 10 and owns the stronger recent run differential.
Plate disciplineDodgersLos has drawn 628 walks this season, 163 more than Atlanta.

Pregame contextStarting pitchers

2026 season (MLB rank among qualified starters)
ERA
1.47
WHIP
0.60
K/9
5.40
BB/9
0.98
FIP
–
HR/9
0.98
OPS/R
–
IP
18.1
Last 5 starts
QUALITY
START %
0%
(0 of 5)
DAYS
REST
9
2026 season (MLB rank among qualified starters)
ERA
1.90
4th
WHIP
1.10
30th
K/9
11.60
5th
BB/9
3.38
133rd
P-Score78i
FIP
–
HR/9
0.00
1st
OPS/R
–
IP
42.2
Last 5 starts
ERA
1.01
QUALITY
START %
20%
(1 of 5)
DAYS
REST
8
How the starters differ
·Snell strikes out 6.2 more batters per nine innings.
·Kerr allows fewer baserunners, with a 0.60 WHIP compared with 1.10.
·Snell allows the lower home-run rate: 0.00 vs 0.98 per nine.
·Snell averages 1.7 more innings per start.

How the lineups match the starters' pitch mix

Pitch data coverage: partial. Usage and velocity only.

Kerr arsenal
PitchUsageVelo
Four-seam36%94.9
Curveball31%81.1
Sinker23%94.6
Slow Curve7%80.3
Cutter4%90.2
Snell arsenal
PitchUsageVelo
Four-seam50%96.0
Curveball22%79.9
Changeup18%84.8
Slider11%88.8

Team OPS vs opposing starter's hand

21st
in MLB
0.696OPS
.600.700.800.9001.000
Dodgers vs LHP (Ray Kerr)
5th
in MLB
0.756OPS
.600.700.800.9001.000

Lineup strength vs today's starter

Weighted by batting-order spot. Season rates are regressed toward league average before they enter the model.

Updated Oct 4, 5:05 PM ET
ATLATL
.737
−29 ptsOPS edge
LADLAD
.766

Slight edge: LAD

Lineups

Final lineupsOrder from the stored snapshot; treat as unofficial until the card is filed.Full lineup page
Atlanta BravesOfficial lineupvs LHP Blake Snell
Los Angeles DodgersOfficial lineupvs LHP Ray Kerr

Team comparison

OffenseATLATL·LADLAD
AVG.246 12th.257 3rd
OPS.718 17th.762 2nd
Home runs204 9th204 8th
Runs742 8th801 4th
OBP.309 28th.338 3rd
SLG.409 7th.424 2nd
PitchingATLATL·LADLAD
1stMLB rank30th
ERA3.63vs3.55
ATLLAD
WHIP1.24vs1.14
ATLLAD
K/98.4vs9.5
ATLLAD
HR Allowed185vs172
ATLLAD
BullpenATLATL·LADLAD
1stMLB rank30th
Bullpen ERA3.70vs3.62
no league rank
Bullpen WHIP1.23vs1.23
no league rank
Saves49vs46
ATLLAD
ResultsATLATL·LADLAD
+33811th
Run differential
+4323rd
94–68 Record100–62
4–6 Last 108–2
Last 10 games
L
W
L
W
L
W
L
L
W
L
W
W
W
W
L
L
W
W
W
W
2026 head-to-head
Season Series
1—5
6 Games Played

Frequently asked

Who is starting for the Braves?+
Ray Kerr (1.47 ERA, 0–0) is listed as the starter.
Who is starting for the Dodgers?+
Blake Snell (1.90 ERA, 4–1) is listed as the starter.
What time does the game start?+
8:00 PM ET at UNIQLO Field at Dodger Stadium.
Where is the game being played?+
UNIQLO Field at Dodger Stadium, home of the Los Angeles Dodgers.
Are the lineups confirmed?+
Not as official league cards. The orders shown are the current projected or last-posted lineups.
How have the Braves and Dodgers performed head-to-head?+
Season series: Dodgers 5–1 this season.
How do the starters compare on P-Score?+
P-Score is available for one starter only.